Update December 6: Clinton supporters in Florida are petitioning for a recount there. Let’s take another look at the numbers in Florida, from the New York Times and that spreadsheet by Cook Political Report. As with Michigan, Pennsylvania and Wisconsin (the piece below), there are no anomalies that suggest hidden votes for Clinton lurking uncounted in Florida.
Trump leads Clinton in Florida by 112,911 votes, as of now–a narrow win, in a big state. But the vote for “Others” is 297,178–more than twice Trump’s margin, for a total of more than 409,000 people who didn’t vote for Clinton, well outside a margin where a recount might reasonably be called for.
More importantly, those “others’ broke heavily for right-leaning candidates rather than for Jill Stein. As of now, the numbers in the NYTimes page are 207,043 for Gary Johnson; 16,475 for the Constitution candidate; 9,108 for Rocky de la Fuente; and 74,684 for Independent–a total of 307,310. Stein got 64,399.
In other words, any hope for a changed outcome for Hillary Clinton in Florida has to upset or reverse not only the margin between the major party candidates, but also a roughly five-to-one margin in favor of conservative-leaning ‘third party’ candidates. The hope is a null set. It is preposterous, and our news media who ignore the third-party tallies are failing in their duty to the public which has to determine when, and whether, a recount is called for.
[previous post below]
For the record, I support recounts. The right to vote is paramount, it should be an equal right, and tabulating votes accurately is more important than tabulating them fast. The public should be able to observe. Vote in private, count in public.
However, a recount will not only not change the 2016 outcome in Michigan, Pennsylvania, or Wisconsin, as the Jill Stein and Hillary Clinton campaigns themselves acknowledge. It is unlikely even that Clinton will net additional votes.
Take a quick look at the numbers for candidates other than Trump or Clinton. Reality check for commentators eager to blame ‘third parties’ for Clinton’s losses: in Michigan, Stein pulled 51,463 votes. But Libertarian Gary Johnson pulled 172,136. That’s a margin of more than three to one for the right-leaning ‘third party’ candidate over the left-leaning ‘third party’ candidate. Yes, the number of votes going to Stein in Michigan is more than the number by which Trump beat Clinton (10,704)–almost five times more. But the number going to Johnson is more than sixteen times greater than the winning margin.

Dr. Jill Stein
In Pennsylvania, Stein pulled 49,278 votes. But Johnson pulled 144,536–almost three times as many, and more than twice the margin by which Trump beat Clinton in Pennsylvania (70,779). Trump’s margin as seen exceeded Stein’s votes. Conservative Party candidate Darrell Castle pulled another 21,242.

Gary Johnson, Libertarian candidate
In Wisconsin, Stein got 30,980 votes–greater than Trump’s net over Clinton of 27,257. But Johnson got 106,422 votes, and the conservative Constitution Party candidate got 12,179. Adding these votes to those for the major party candidates yields a left-ish total of 1,413,190 and a right-ish total of 1,528,068. That’s a margin of more than 100,000 votes (114,868 to be precise, using the unofficial results given so far)–not the eyelash-thin margin screamed by the headlines.
Quick points: First, nothing in this picture suggests that hidden hordes wanted to vote for Clinton and were thwarted. Second, it’s funny how the name ‘third party’ applies no matter how many parties are listed. This dismissing everyone not locked into a major party should be rethought–especially in Wisconsin with its proud populist tradition. Third, even if the Democrats had won by a razor-thin margin in Michigan or the other two states, the thin margin would be shameful. From a small-d perspective, the Clinton candidacy was an embarrassment.
Fourth, blaming Clinton’s loss on a ‘third party’ is exactly what might be expected of the Clintons and their media allies (Rachel Maddow, for example)–but it is hardly progressive. Nor is it accurate. The fact remains that Jill Stein’s vote was substantially smaller in all three states than the votes for the Libertarian, Constitution, and other right-leaning candidates.
Meanwhile, this from Politico:
PROPUBLICA KNOCKS DOWN VOTER FRAUD CLAIMS — “We had 1,100 people monitoring the vote on Election Day. We saw no evidence the election was ‘rigged’ no matter what Stein or Trump say,” the investigative non-profit outlet said in a series of tweets last night. “Electionland had huge amounts of data. 600 ppl monitored social media. We had @LawyersComm call logs. We had 120,000 people texting us. We had 400 partner reporters across the country, including three of the largest news organizations in the U.S. We had voting experts in the room with us and election sources all over the country. We saw plenty of problems: Long lines, broken voting machines, incorrect poll books, confusion abt voter ID laws. But we saw no reason to doubt the results.” [Here, please imagine ‘handclap’ emojis where the ellipses are.] There … was … no … widespread … voter … fraud.” http://bit.ly/2gyBJ0K
It remains unclear why Dr. Stein is pursuing the recount. She did raise almost $7 million for the effort, which is the way to get Hillary Clinton’s attention. Ironically, Clinton has now joined the recount campaign, although Pennsylvania, Michigan, and Wisconsin did not receive much love from the Clinton campaign in the form of campaign stops or more importantly policy addresses.
Clinton’s participation seems mainly to reflect her personal problems. As long as she can fan the dying ember of a hope that she is adored, apparently, she will keep the ‘election’ going. Again, no one projects that a recount will change the outcome. However, a delay hypothetically could take two states out of Trump’s win column on December 13 or December 19, whichever is treated as the Electoral College deadline.
Abolish the Electoral College? Why?
One problem with the abolish-the-Electoral-College picture is that it is hard to envision these three ‘Rust Belt’ states getting more attention without the prize of Electoral votes than they got in 2016 with a combined 46 Electoral votes, or 17 percent of the total needed to win the White House. As we already know, these areas are not booming.
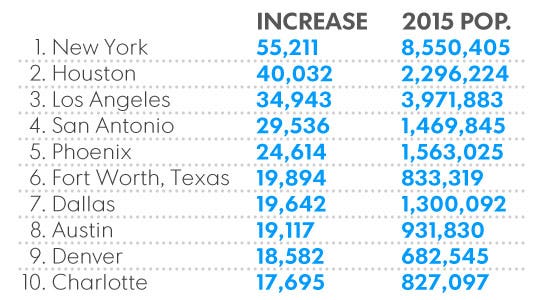
Recent U.S. population growth
Add Ohio, Iowa, Indiana, Minnesota, and Illinois to Michigan, Pennsylvania, and Wisconsin, and you get 41 percent of the Electoral votes needed to win. First, nothing makes neglecting these states anything but stupid, except for whatever makes it arrogant, self-important, or self-deluded to the point of delirium. Second, to my confreres in the media–if you want to avoid being perceived as elitist, quit using the phrase ‘Rust Belt’. Try losing your job and see how you like it, or watch your entire occupation go under. Wait–that’s already happening . . .
Progressives above all should repudiate this attitude. People who have a hard time finding decent jobs in small towns, open areas, or small cities should not be ridiculed. Nor should they be dismissed from the electorate, which might be the effect of abolishing the Electoral College. Look how well it worked this time.
I despise ridicule directed against any sector of the U.S. (like David Brooks’ comment about ‘gene pools’, for example). A superficial dismissal may rest–superficially–on a careless assumption of moral superiority (racial disparities in the Southeast, Latino poverty in the Southwest, random bigotry in the ‘Rust Belt’; take your pick). So what do the election analysts say about a small city like Binghamton, New York? This was a town where, if you recall, the big employer was IBM. Then IBM left–and now one of the town’s biggest employers is SUNY Binghamton, a nice place but not exactly hiring on the scale of General Motors or U.S. Steel back when. There is much to be said for the locale, from what I hear. You can get a very nice house for $40,000. But where do you find the job to pay for it?